Was recently coding like a monkey until I started seeing some performance issues on my dashboard. Once loaded with real data, things start to slow down to a crawl. The dashboard gets its data from a few API endpoints powered with django-rest-framework.
After enabling django-debug-toolbar here is what I am looking at:
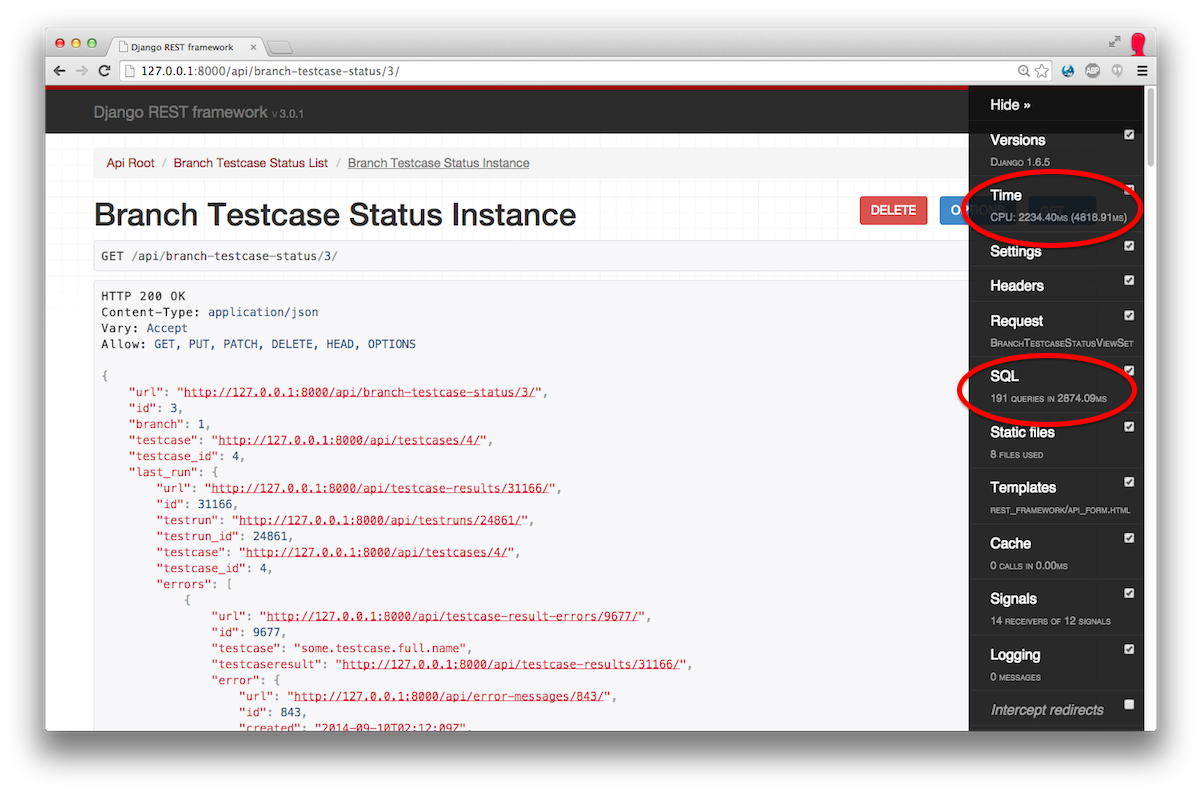
Yes, 2000 milliseconds and 190-some queries. Deeply-nested serializers will do that to you… On a closer look, I see many very similar queries:
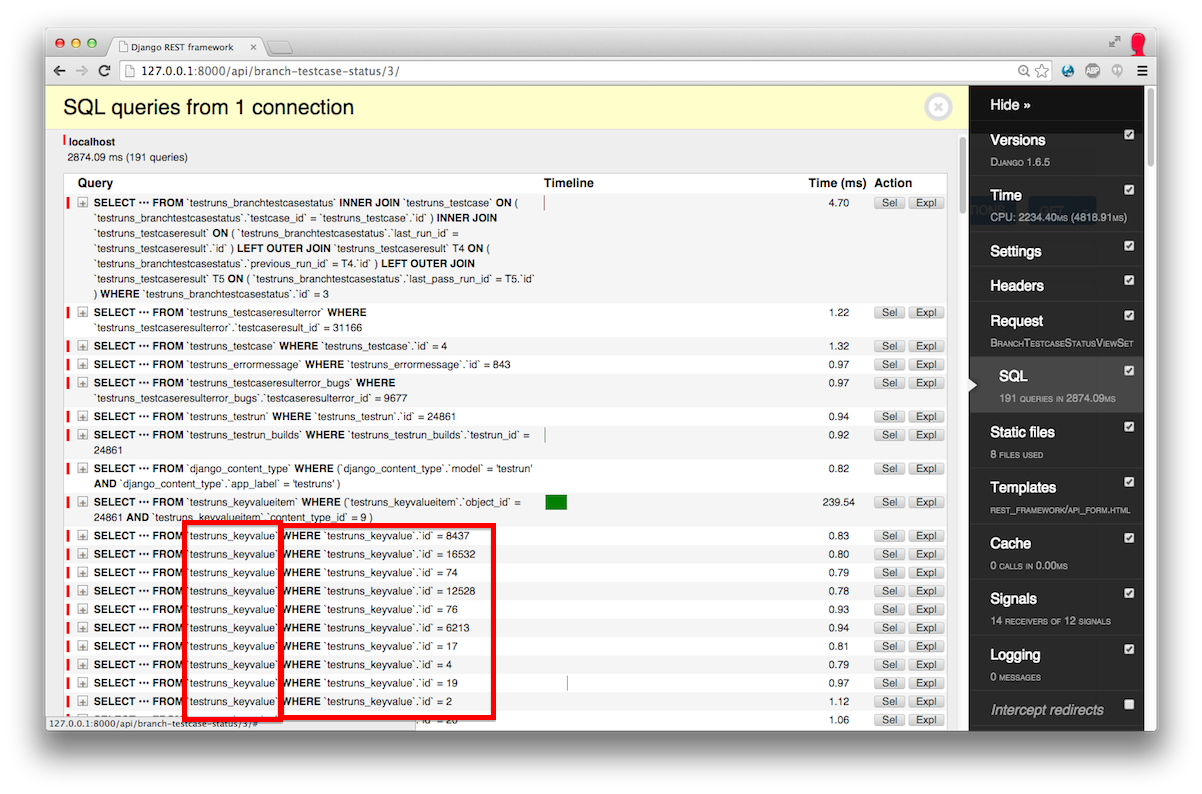
I decide to drill down to one of the nested serializers (you have to start someplace, right?) since those queries are directly related. Seems like there is one query for each ForeignKey.
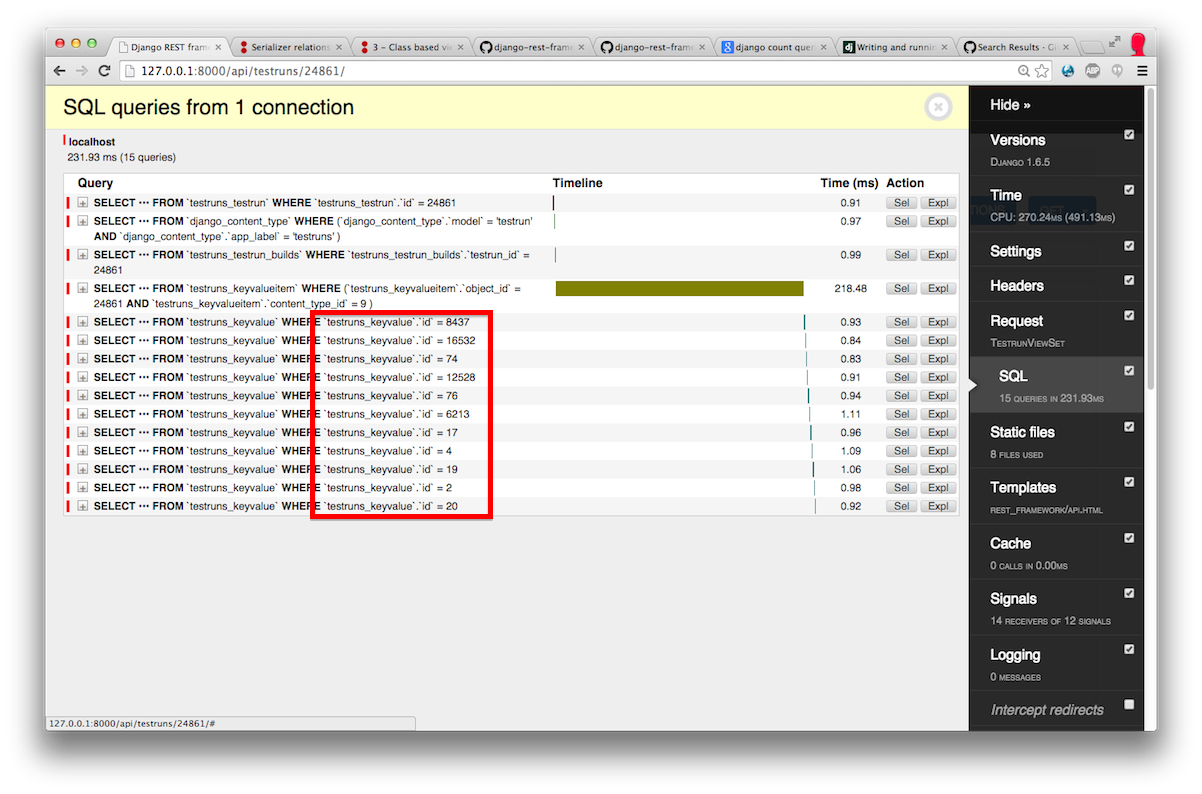
How to cut down the number of queries? Easy. Where possible you can use select_related or prefetch_related. In my use case, prefetch_related makes more sense since I have a nested serializer that could leverage having the whole related object.
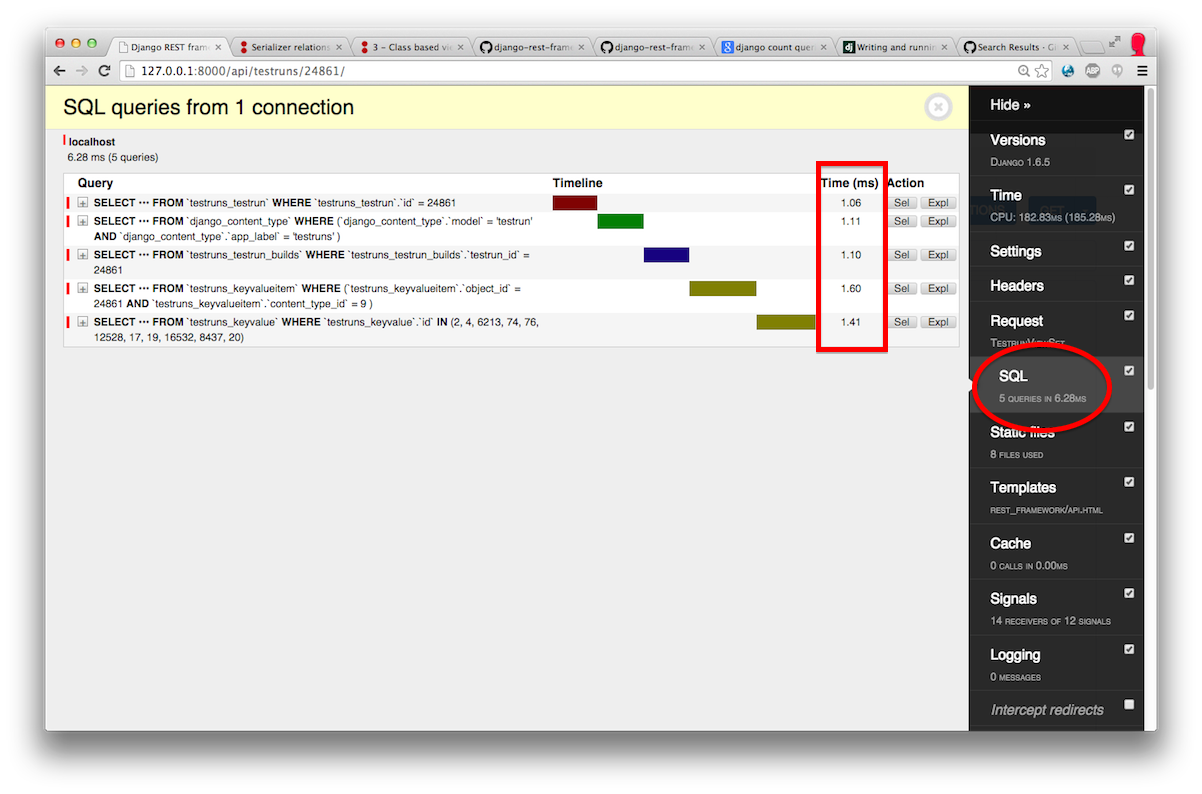
You can see that the number of queries is reduced, and the presence of WHERE in the last query. However something else is eating up some of the time.
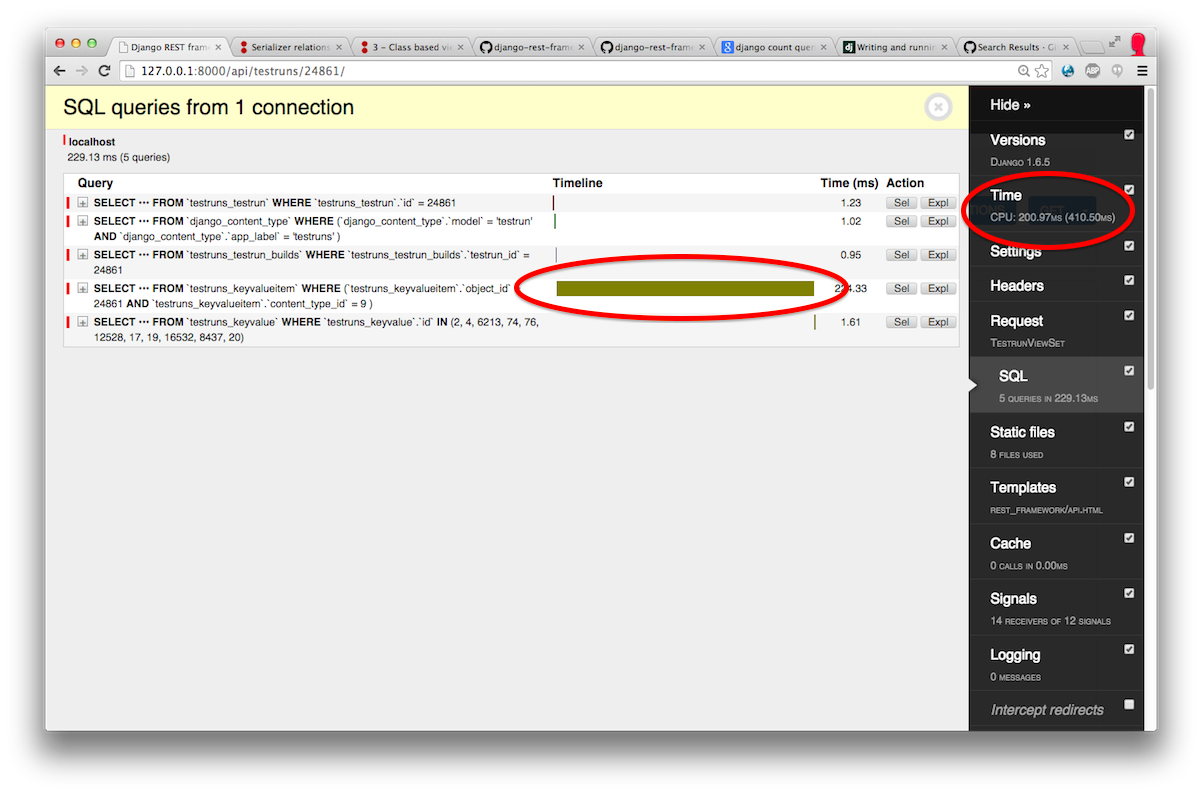
What is eating up the query time is an inefficient query. I could have used the EXPL. (explain query) button, but I know exactly what is happening: my custom GenericForeignKey is based on fields that are not indexed properly.
Just need to add db_index=True and get the sql with ./manage.py sqlall.
SQL CREATE INDEX `testruns_keyvalueitem_37ef4eb4` ON `testruns_keyvalueitem` (`content_type_id`);
Instant gratification:
That’s it for now.